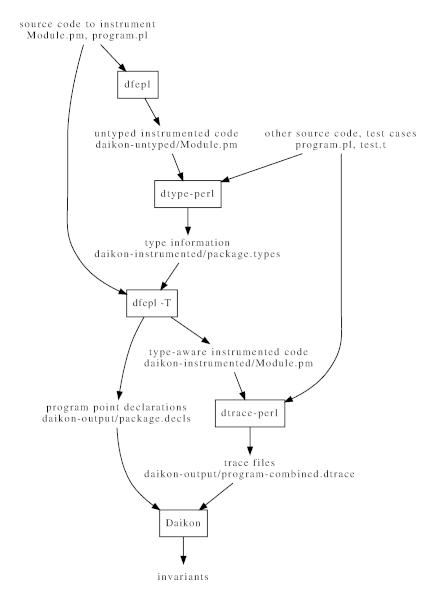
Figure 7.1: Workflow of instrumenting Perl code with dfepl.
Next: Tools, Previous: Enhancing Daikon output, Up: Top [Contents][Index]
The Daikon invariant detector is a machine learning tool that finds patterns (invariants) in data. That data can come from any source. A front end is a tool that converts data from some other format into Daikon’s input format.
Daikon is often used to find invariants over variable values in a running program. For that use case, the most common type of front end is an instrumenter. An instrumenter changes a program to add instrumentation (sometimes called probes) so that when the program runs, it does all its usual operations and also produces output to a side file, such as a Daikon .dtrace file (see Reading dtrace files in Daikon Developer Manual).
This chapter describes several front ends that are distributed with Daikon. It is relatively easy to build your own front end, if these do not serve your purpose; we are aware of a number of users who have done so (see Other front ends). For more information about building a new front end, see New front ends in Daikon Developer Manual.
| • Chicory | ||
| • DynComp for Java | ||
| • Kvasir | ||
| • Celeriac | ||
| • dfepl | ||
| • convertcsv.pl | ||
| • Other front ends |
Next: DynComp for Java, Up: Front ends and instrumentation [Contents][Index]
The Daikon front end for Java, named Chicory, executes Java programs, creates data trace (.dtrace) files, and optionally runs Daikon on them. Chicory is named after the chicory plant, whose root is sometimes used as a coffee substitute or flavor enhancer.
While Daikon can be run using only the Chicory front end, it is highly recommend that DynComp be run prior to Chicory. See DynComp for Java for more details.
To use Chicory, run your program as you normally would, but
replace the java command with java daikon.Chicory. For
instance, if you usually run
java -cp myclasspath mypackage.MyClass arg1 arg2 arg3
then instead you would run
java -cp myclasspath:${DAIKONDIR}/daikon.jar daikon.Chicory \
     mypackage.MyClass arg1 arg2 arg3
This runs your program and creates file MyClass.dtrace in the current directory. Furthermore, a single command can both create a trace file and run Daikon:
java -cp myclasspath:${DAIKONDIR}/daikon.jar daikon.Chicory \
     --daikon mypackage.MyClass arg1 arg2 arg3
See below for more options.
That’s all there is to it! Since Chicory instruments class files
directly as they are loaded into Java,
you do not need to perform separate instrumentation and recompilation steps.
However, you should compile your program with debugging information
enabled (the -g command-line switch to javac);
otherwise, Chicory uses the names arg0, arg1, … as
the names of method arguments.
Chicory must be run in a version 8 (or later) JVM, but it is backward-compatible with older versions of Java code. Chicory can process class files from any version of Java.
| • Chicory options | ||
| • Static fields (global variables) | ||
| • Troubleshooting Chicory |
Next: Static fields (global variables), Up: Chicory [Contents][Index]
Chicory is invoked as follows:
java -cp ${DAIKONDIR}/daikon.jar daikon.Chicory \
     chicory-args classname args
where
java classname args
is a valid invocation of Java.
This section lists the optional command-line arguments to Chicory, which appear before the classname on the Chicory command line.
| • Program points in Chicory output | ||
| • Variables in Chicory output | ||
| • Chicory miscellaneous options |
Next: Variables in Chicory output, Up: Chicory options [Contents][Index]
This section lists options that control which program points appear in Chicory’s output.
Only produce trace output for classes/procedures/program points whose names match the given regular expression. This option may be supplied multiple times, and may be used in conjunction with --ppt-omit-pattern.
When this switch is supplied, filtering occurs in the following way: for each program point, Chicory checks the fully qualified class name, the method name, and the the program point name against each regexp that was supplied. If any of these match, then the program point is included in the instrumentation.
Suppose that method bar is defined only in class C. Then to
traces only bar, you could match the method name (in any class)
with regular expression
‘bar$’, or you could match the program point name with ‘C\.bar\(’.
java -cp ${DAIKONDIR}/daikon.jar daikon.Chicory \
     --ppt-select-pattern='bar$' ...
java -cp ${DAIKONDIR}/daikon.jar daikon.Chicory \
     --ppt-select-pattern='C\.bar\(' ...
Do not produce data trace output for classes/procedures/program points whose names match the given regular expression. This reduces the size of the data trace file and also may make the instrumented program run faster, since it need not output those variables.
This option works just like --ppt-select-pattern does, except that matching program points are excluded, not included.
The --ppt-omit-pattern argument may be supplied multiple times, in order to specify multiple omitting criteria. A program point is omitted if its fully qualified class, fully qualified procedure name, or complete program point name exactly matches one of the omitting criteria. A regular expression matches if it matches any portion of the program point name. Note that currently only classes are matched, not each full program point name. Thus, either all of a class’s methods are traced, or none of them are.
Here are examples of how to avoid detecting invariants over various parts of your program.
java -cp ${DAIKONDIR}/daikon.jar daikon.Chicory \
     '--ppt-omit-pattern=^org\.junit\.' ...
java -cp ${DAIKONDIR}/daikon.jar daikon.Chicory \
     '--ppt-omit-pattern=^daikon\.util\..*' ...
java -cp ${DAIKONDIR}/daikon.jar daikon.Chicory \
     '--ppt-omit-pattern=HashSetLinear\$HslIterator' ...
java -cp ${DAIKONDIR}/daikon.jar daikon.Chicory \
     '--ppt-omit-pattern=StackAr.topAndPop()' ...
java -cp ${DAIKONDIR}/daikon.jar daikon.Chicory \
     '--ppt-omit-pattern=StackAr.<init>(int):::EXIT33' ...
When this option is chosen, Chicory will record each program point until that program point has been executed sample-cnt times. Chicory will then begin sampling. Sampling starts at 10% and decreases by a factor of 10 each time another sample-cnt samples have been recorded. If sample-cnt is 0, then all calls will be recorded.
Chicory treats classes that match the regex as boot classes. Such classes are not instrumented.
Causes Chicory to output empty dtrace records when static initializers are entered and exited. This is useful for clients that use Chicory to trace method entry and exit.
Next: Chicory miscellaneous options, Previous: Program points in Chicory output, Up: Chicory options [Contents][Index]
This section lists options that control which variables appear in Chicory’s output.
Depth to which to examine structure components (default 2).
This parameter determines which variables the front end causes to be output at
run time. For instance, suppose that a program contained the following
data structures and a method foo:
class A {
  int x;
  B b;
}
class B {
  int y;
  int z;
}

class Link {
  int val;
  Link next;
}

void foo(A myA, Link myList) { ... }
Consider what variables would be output at the entry to method foo:
myA and
myList would be examined; those variables could be determined to
be equal or not equal to other variables.
myA.x, the identity of
myA.b, myList.val, and the identity of myList.next
would be examined.
myA.b.y,
myA.b.z, the identity of myList.next.next, and
myList.next.val would be examined.
Values whose value is undefined are not examined. For instance, if myA
is null on a particular execution of a program point, then
myA.b is not accessed on that execution regardless of the depth
parameter. That variable appears in the .dtrace file, but its
value is marked as nonsensical.
Do not include variables whose name matches the regular expression.
(For static fields, the fully-qualified name is used.)
Variables will be omitted from each program point in which they appear.
Also see Daikon’s --var-omit-pattern command-line argument.
Note that you may need to omit the same variables from downstream tools
that process invariant files, such as Annotate
When this switch is on, Chicory will traverse exactly those fields that are
visible from a given program point. For instance, only the public
fields of class pack1.B will be included at a program point for
class pack2.A whether or not pack1.B is instrumented.
By default, Chicory outputs all fields in instrumented classes (even
those that would not be accessible in Java code at the given program point)
and outputs no fields from uninstrumented classes (even those that are
accessible). When you supply
--std-visibility, consider also supplying --purity-file to
enrich the set of expressions in Daikon’s output.
File pure-methods-file lists the pure methods (sometimes called
observer methods; one type of observer is getter methods)
in a Java program. Pure methods have no externally
side effects, such as setting variables or producing output. For
example, most implementations of the hashCode(),
toString(), and equals() methods are pure.
For each variable, Chicory adds to the trace new fields that represent invoking each pure method on the variable. (Currently, Chicory does so only for pure methods that take no parameters, and obviously this mechanism is only useful for methods that return a value: a pure method that returns no value does nothing!)
Here is an example:
class Point {
  private int x, y;
  public int radiusSquared() {
    return x*x + y*y;
  }
}
If radiusSquared() has been specified as pure, then for each point
p, Chicory will output the variables p.x,
p.y, and p.radiusSquared(). Use of pure
methods can improve the Daikon output, since they represent information
that the programmer considered important but that is not necessarily
stored in a variable.
Invoking a pure method at any time in an application should not change the application’s behavior. If a non-pure method is listed in a purity file, then application behavior can change. Chicory does not verify the purity of methods listed in the purity file.
The purity file lists a set of methods, one per line. The format of each method is given by the Sun JDK API:
The string is formatted as the method access modifiers, if any, followed by the method return type, followed by a space, followed by the class declaring the method, followed by a period, followed by the method name, followed by a parenthesized, comma-separated list of the method’s formal parameter types. If the method throws checked exceptions, the parameter list is followed by a space, followed by the word throws followed by a comma-separated list of the thrown exception types. For example:
public boolean java.lang.Object.equals(java.lang.Object)The access modifiers are placed in canonical order as specified by "The Java Language Specification". This is public, protected or private first, and then other modifiers in the following order: abstract, static, final, synchronized native.
By convention, pure-methods-file has the suffix .pure. If pure-methods-file is specified as a relative (not absolute) file name, it is searched for in the configuration directory specified via --configs=directory, or in the current directory if no configuration directory is specified.
One way to create a .pure file is to run the Purity Analysis Kit (https://jppa.sourceforge.net/). If you supply the --daikon-purity-file when running the Purity Analysis Kit, it writes a file that can be supplied to Chicory.
Previous: Variables in Chicory output, Up: Chicory options [Contents][Index]
This section lists all other Chicory options — that is, all options that do not control which program points and variables appear in Chicory’s output.
Print a help message.
Print information about the classes being processed.
Produce debugging information. For other debugging options, run Chicory with the --help option.
Specifies the default name for the trace output (.dtrace) file.
If this is not specified, then the value of the DTRACEFILE
environment variable (at the time the instrumented program runs) is
used. If that environment variable is not used, then the default is
./CLASSNAME.dtrace.gz.
If the DTRACEAPPEND environment
variable is set to any value, the .dtrace file will be appended to
instead of overwritten. Compressed data trace files may not be appended
to. In some cases you may find a single large data trace file more
convenient; in other cases, a collection of smaller data trace files may
give you more control over which subsets of runs to invoke Daikon on.
Note that while Chicory will accept any valid value for filename, it must contain .dtrace to be recognized by Daikon.
This option specifies a declaration file (see Declarations in Daikon Developer Manual) that contains comparability information. This information will be incorporated in the output of Chicory. Any variables not included in the comparability file will have their comparability set so that they are comparable to all other variables of the same type. The DynComp tool is a common source for such a file (see DynComp for Java and DynComp for C/C++).
Write the .dtrace trace output file to the specified directory. The default is the current directory.
Chicory will use this location to search for configuration files. Currently, this only includes *.pure files.
After creating a data trace (.dtrace) file, run Daikon on it. To specify arguments to Daikon use the --daikon-args option. Also see the --daikon-online option.
This option supplies Daikon with a single trace from one execution of your program. By contrast to this option (and --daikon-online), if you invoke Daikon from the command line, you can supply Daikon with as many trace files as you wish.
If the program that Chicory is tracing aborts with an error, then Chicory does not run Daikon, but prints a message such as “Warning: Did not run Daikon because target exited with 1 status”.
This option is like --daikon, except that no .dtrace data trace file is produced. Instead, Chicory sends trace information over a socket to Daikon, which processes the information incrementally (“online”), as Chicory produces it.
Just like with the --daikon option, Daikon is only given a single trace from one execution of your program.
The Kvasir front end also supports online execution, via use of (normal or named) Linux pipes (see Online execution).
Specifies arguments to be passed to Daikon if the --daikon or --daikon-online options are used.
Specifies the maximum size, in bytes, of the memory allocation pool for
the target program. Also applies to Daikon, if the --daikon
command-line argument is given.
The size is specified in the same manner as the
-Xmx switch to java; for example: --heap-size=7g.
Specifies the absolute pathname to the ChicoryPremain.jar file.
Chicory requires this jar file in order to execute. By default Chicory
looks for the jar file in the classpath and in ${DAIKONDIR}/java
(where DAIKONDIR is the
complete installation of Daikon).
Chicory can also use the daikon.jar file for this purpose. If it doesn’t find ChicoryPremain.jar above, it will use daikon.jar itself (if a file named daikon.jar appears in the classpath). If the Daikon jar file is not named daikon.jar, you can use this switch to specify its name. For example:
--premain=C:\lib\daikon-5.8.24.jar
Next: Troubleshooting Chicory, Previous: Chicory options, Up: Chicory [Contents][Index]
Chicory (Daikon’s front end for Java) outputs the values of static fields in the current class, but not in other classes. That means that Daikon cannot report properties over static fields in other classes, because it never sees their values. (By contrast, Kvasir (see Kvasir) supplies the values of C/C++ global variables to Daikon.)
If you need Daikon to include all static variables when processing each class, then ask the maintainers to add that feature to Chicory (or work with them to implement the enhancement). In the meanwhile, here are two workarounds.
Previous: Static fields (global variables), Up: Chicory [Contents][Index]
A message like
Chicory warning: ClassFile: ... - classfile version (49) is out of date and may not be processed correctly.
means that your program uses an old classfile format that is missing
information that Chicory uses during instrumentation. Chicory might work
properly, or it might not. You can eliminate the warning by re-compiling
your program, using a -target command-line argument for a more
recent version of Java. (In the example above, classfile version
49 corresponds to Java 5, which was released in 2004; Java 6 was released
in 2006, and Java 8 was released in 2014.)
Programs that are run via JUnit often benefit from using --ppt-omit-pattern=org.junit as an option to Chicory (and DynComp). This avoids inferring invariants about the JUnit library, which are almost always uninteresting.
Next: Kvasir, Previous: Chicory, Up: Front ends and instrumentation [Contents][Index]
While Daikon can be run using only the Chicory front end, it is highly recommend that DynComp be run prior to Chicory. The DynComp dynamic comparability analysis tool performs dynamic type inference to group variables at each program point into comparability sets (see Program point declarations in Daikon Developer Manual for the file representation of these sets). All variables in each comparability set belong to the same “abstract type” of data that the programmer likely intended to represent, which is a richer set of types than the few basic declared types (e.g., int, float) provided by the language.
Without comparability information, Daikon attempts to find invariants
over all pairs (and sometimes triples) of variables present at every
program point. This can lead to two negative consequences: First, it
may take lots of time and memory to infer all of these invariants,
especially when there are many global or derived variables present.
Second, many of those invariants are true but meaningless because they
relate variables which conceptually represent different types (e.g., an
invariant such as winterDays < year is true but meaningless
because days and years are not comparable).
Consider the example below:
public class Year {
    public static void main(String[] args) {
        int year = 2005;
        int winterDays = 58;
        int summerDays = 307;
        compute(year, winterDays, summerDays);
    }

    public static int compute(int yr, int d1, int d2) {
        if (0 != yr % 4)
            return d1 + d2;
        else
            return d1 + d2 + 1;
    }
}
The three variables in main() all have the same Java
representation type, int, but two of them hold related quantities
(numbers of days), as can be determined by the fact that they interact
when the program adds them, whereas the other contains a conceptually
distinct quantity (a year). The abstract types “day” and “year” are
both represented as int, but DynComp can differentiate them with
its dynamic analysis. For example, DynComp can infer that
winterDays and summerDays are comparable (belong to the
same abstract type) because the program adds their values together
within the compute() function.
Without comparability information, Daikon attempts to find invariants
over all pairs (and sometimes triples) of variables present at every
program point. This can lead to two negative consequences: First, it
may take lots of time and memory to infer all of these invariants,
especially when there are many global or derived variables present.
Second, many of those invariants are true but meaningless because they
relate variables which conceptually represent different types (e.g., an
invariant such as winterDays < year is true but meaningless
because days and years are not comparable).
To use DynComp, run your program as you normally would, but replace the
java command with java daikon.DynComp. For instance,
if you usually run
java -cp myclasspath mypackage.MyClass arg1 arg2 arg3
then instead you would run
java -cp myclasspath:${DAIKONDIR}/daikon.jar daikon.DynComp mypackage.MyClass arg1 arg2 arg3
This runs your program and creates the file MyClass.decls-DynComp in the current directory. The .decls-DynComp file may be passed to Chicory, as described in Detecting invariants in Java programs.
java -cp ${DAIKONDIR}/daikon.jar daikon.Chicory \
     --comparability-file=MyClass.decls-DynComp \
     mypackage.MyClass arg1 arg2 arg3
See below for more options.
Here is part of a sample .decls-DynComp file generated by running DynComp on the example above:
ppt Year.compute(int, int, int):::ENTER
ppt-type enter
variable yr
  var-kind variable
  dec-type int
  rep-type int
  flags is_param
  comparability 3
variable d1
  var-kind variable
  dec-type int
  rep-type int
  flags is_param
  comparability 2
variable d2
  var-kind variable
  dec-type int
  rep-type int
  flags is_param
  comparability 2

ppt Year.compute(int, int, int):::EXIT11
ppt-type subexit
variable yr
  var-kind variable
  dec-type int
  rep-type int
  flags is_param
  comparability 3
variable d1
  var-kind variable
  dec-type int
  rep-type int
  flags is_param
  comparability 2
variable d2
  var-kind variable
  dec-type int
  rep-type int
  flags is_param
  comparability 2
variable return
  var-kind return
  dec-type int
  rep-type int
  comparability 2
The declaration file format is described in Program point declarations in Daikon Developer Manual.
You can cause DynComp to create two additional representations of the comparability information.
Given the option --comparability-file=filename, DynComp outputs comparability sets as sets. The above .decls-DynComp output corresponds to the following comparability-file output:
Daikon Variable sets for Year.compute(int yr, int d1, int d2) enter
  [2] [daikon.chicory.ParameterInfo:d1] [daikon.chicory.ParameterInfo:d2]
  [1] [daikon.chicory.ParameterInfo:yr]
Daikon Variable sets for Year.compute(int yr, int d1, int d2) exit
  [3] [daikon.chicory.ParameterInfo:d1, daikon.chicory.ParameterInfo:
       d2, daikon.chicory.ReturnInfo:return]
  [1] [daikon.chicory.ParameterInfo:yr]
Given the option --trace-file=filename, DynComp outputs comparability sets as trees, structured such that each variable in the tree has interacted with its children. The lack of a parent-child relationship between two variables in a set does not imply anything about whether they interacted. The above .decls-DynComp output corresponds to the following trace-file output:
Daikon Traced Tree for Year.compute(int yr, int d1, int d2) enter
daikon.chicory.ParameterInfo:d1
--daikon.chicory.ParameterInfo:d2 ()

daikon.chicory.ParameterInfo:yr


Daikon Traced Tree for Year.compute(int yr, int d1, int d2) exit
daikon.chicory.ParameterInfo:d1
--daikon.chicory.ParameterInfo:d2 (Year:compute(), 11)
--daikon.chicory.ReturnInfo:return (Year:compute(), 11)

daikon.chicory.ParameterInfo yr
The file here shows that d1, d2, and the return value of
the compute method are in the same comparability set; this is
correct, as they are all of the abstract type “days”. The variable
yr is in its own comparability set; it has abstract type “year”,
and so is not comparable to the other variables. In addition, the structure
of the [d1, d2, return] set shows that at some point, d1 interacted
with d2, and that d2 interacted with return. The absence of
a d1 -- return edge does not imply that d1 and return never
interacted directly.
In addition, non-root nodes in the trace trees can indicate a list of class names,
method names, and line numbers at which values interacted, resulting in comparability
between the preceding child node and its parent. In the above example, d1
interacted with d2 on line 11 of the compute method of the Year
class.
Duplicate values in this list represent the results of separate calls to
another method which each of the relevant variables. For example, if we modify
the sample to use global variables instead of locals and add an additional call
to compute:
public class Year2 {
    static int year = 2005;
    static int winterDays = 58;
    static int summerDays = 307;
    static int schoolDays = 180;
    static int breakDays = 185;
    public static void main(String[] args) {
        compute(year, winterDays, summerDays);
        compute(year, schoolDays, breakDays);
    }

    public static int compute(int yr, int d1, int d2) {
        if (0 != yr % 4)
            return d1 + d2;
        else
            return d1 + d2 + 1;
    }
}
then for compute we might see
this output:
DynComp Traced Tree for Year2.compute(int yr, int d1, int d2) exit
daikon.chicory.FieldInfo:Year2.schoolDays
--daikon.chicory.FieldInfo:Year2.breakDays (Year2:compute(), 14)
--daikon.chicory.ParameterInfo:d1 (Year2:compute(), 14)
----daikon.chicory.FieldInfo:Year2.winterDays (Year2:compute(), 14)
------daikon.chicory.FieldInfo:Year2.summerDays (Year2:compute(), 14)
------daikon.chicory.ParameterInfo:d2 (Year2:compute(), 14)
------daikon.chicory.ReturnInfo:return (Year2:compute(), 14)
Empty lists indicate that no non-assignment interactions occurred in the series of interactions connecting the two variables.
Elements of these lists are essentially parts of stack traces. The maximum number of stack trace levels displayed is set by --trace-line-depth, which is equal to 1 by default.
For these files, DynComp also has a --abridged-vars option that replaces text
like daikon.chicory.ParameterInfo:d2 with text like Parameter d2 in the comparability-file
and trace-file. It writes this instead of
daikon.chicory.ThisObjInfo:this; and return instead of
daikon.chicory.ReturnInfo:return. This option is off by default, but can be
turned on with --abridged-vars.
| • Instrumenting the JDK with DynComp | ||
| • DynComp for Java options | ||
| • Instrumentation of Object methods | ||
| • Troubleshooting DynComp for Java | ||
| • DynComp for Java known bugs |
Next: DynComp for Java options, Up: DynComp for Java [Contents][Index]
If you did not already do so when installing Daikon (see Installing Daikon), follow the instructions here to build an instrumented copy of the JDK. Use the following command:
make -C ${DAIKONDIR}/java dcomp_rt.jar
Either the JAVA_HOME environment variable must be set, or
javac must be on the execution path.
This command instruments the classes in the
rt.jar file of the JDK, and creates a new file,
dcomp_rt.jar, in the java directory.
Building dcomp_rt requires 10-30 minutes to complete and uses 1024 MB of memory. Regular progress indicators are printed to standard output.
You can ignore warnings issued during the instrumentation process, so long as the make target itself completes normally.
If there are any methods in the JDK that DynComp is unable to instrument, their names will be printed at the end of the instrumentation process. This is not a problem unless your application calls one of these methods (directly or indirectly). If one of these methods is called, a ‘NoSuchMethodException’ will be generated when the call is attempted.
If the instrumented JDK is in a non-standard location, use the --rt-file switch to specify its location, or change your classpath to include it.
One final note: if you update your JDK in any way (such as an OS upgrade), you will need to rebuild dcomp_rt.jar.
Next: Instrumentation of Object methods, Previous: Instrumenting the JDK with DynComp, Up: DynComp for Java [Contents][Index]
DynComp is invoked as follows:
java -cp myclasspath:${DAIKONDIR}/daikon.jar daikon.DynComp dyncomp-args classname args
where
java classname args
is a valid invocation of Java.
This section lists the optional command-line arguments to DynComp, which appear before the classname on the DynComp command line.
Print a help message.
Print information about the classes being processed.
Dump the instrumented class files to the bin subdirectory of the directory specified by --debug-dir. Dump the original, uninstrumented class files to the orig subdirectory of the directory specified by --debug-dir. If --debug-dir is not specified, it defaults to debug/ in the current working directory.
Produce debugging information. (This produces a lot of output!) This option also turns on --dump.
The directory in which to dump instrumented class files (only if dump or --debug is specified). Defaults to debug in the current working directory.
The directory in which to create output files. Defaults to the current working directory.
Output filename for .decls file suitable for input to Chicory. Defaults to target_program.decls-DynComp.
Output filename for a more easily human-readable file summarizing comparability sets. The file is intended primarily for debugging. It is not meant to be used as input to Chicory’s --comparability-file option; use the output from DynComp’s --decl-file option for that.
If specified, write a human-readable file showing some of the interactions that occurred. The file is intended primarily for debugging.
Controls size of the stack displayed in tracing the interactions that occurred. Default behavior is to only display one element in the stack — that is, display at most the topmost function on the stack when the interaction occurred. This switch has no effect if --trace-file is not specified, or is null.
When this switch is on, DynComp abridges the variables printed in the files specified by --comparability-file and --trace-file. For example, DynComp will output ‘Field foo’ instead of ‘dyncomp.chicory.FieldInfo:MyClass.foo’. In particular, it replaces ‘dyncomp.chicory.ReturnInfo:return’ with ‘return’ and ‘dyncomp.chicory.ThisObjInfo:this’ with ‘this’.
Only emit program points that match regex. Specifically, a program point is considered to match regex if the fully qualified class name, the method name, or the program point name matches regex. The behavior of this switch is the same as in Chicory (see Program points in Chicory output).
This option can be specified multiple times, and may be used in conjunction with --ppt-omit-pattern. If a program point matches both a select pattern and an omit pattern, it is omitted.
Suppress program points that match regex. Specifically, a program point is considered to match regex if the fully qualified class name, the method name, or the program point name matches regex. The behavior of this switch is the same as in Chicory (see Program points in Chicory output).
This option can be specified multiple times, any may be used in conjunction with --ppt-select-pattern. If a program point matches both a select pattern and an omit pattern, it is omitted.
Specifies the location of the instrumented JDK (see Instrumenting the JDK with DynComp). This option is rarely necessary, because if --rt-file is not specified, DynComp will search for a file named dcomp_rt.jar along the classpath, and in ${DAIKONDIR}/java. Both this file and the current classpath are placed on the boot classpath for DynComp’s execution.
If the filename is NONE, then
run DynComp with an uninstrumented JDK, instead of with a
copy of the JDK that has been instrumented with DynComp.
This will improve run-time performance, but will
yield less accurate results.
When this switch is on, DynComp traverses exactly those fields that are visible from a given program point. For an example, see Variables in Chicory output.
Depth to which to examine structure components (default 2). This parameter determines which variables the front end causes to be output at run time. For an example, see Variables in Chicory output.
Specifies the absolute pathname to the dcomp_premain.jar file.
DynComp requires this jar file in order to execute. By default DynComp
looks for the jar file in the classpath and in ${DAIKONDIR}/java
(where DAIKONDIR is the
complete installation of Daikon).
DynComp can also use the daikon.jar file for this purpose. If it doesn’t find dcomp_premain.jar above, it will use daikon.jar itself (if a file named daikon.jar appears in the classpath). If the Daikon jar file is not named daikon.jar, you can use this switch to specify its name. For example:
--premain=C:\lib\daikon-5.8.24.jar
Next: Troubleshooting DynComp for Java, Previous: DynComp for Java options, Up: DynComp for Java [Contents][Index]
DynComp is unable to directly instrument methods of the class
Object, such as clone and equals. DynComp uses a
few tricks, described here in brief, to track comparability in these
methods.
Calls such as o1.equals(o2) are replaced with calls to a static
method in DynComp, dcomp_equals(o1, o2). This static method
dynamically determines whether or not o1 is an instance of a
class that has been instrumented by DynComp; every such class
implements the interface DCompInstrumented. If so, it attempts
to invoke the instrumented version of the equals method for
o1. If not, or if o1 has not overridden the
equals method from Object, then no instrumented version
exists, so the uninstrumented version is invoked.
In either case, the references o1 and o2 are considered
to be comparable. In a future release, we will provide a command-line
switch to customize this behavior.
The clone method operates in a similar manner, choosing
dynamically to invoke the instrumented method or the uninstrumented
method. In the case of clone, the methods are invoked via
reflection. In either case, the object being cloned and the resulting
clone are made comparable to each other. Again, we will provide a
switch to customize this behavior in a future release.
Next: DynComp for Java known bugs, Previous: Instrumentation of Object methods, Up: DynComp for Java [Contents][Index]
If DynComp crashes the JVM, then the most likely problem is that you are running with a wrong version of the JDK. Re-instrument the JDK as described in Instrumenting the JDK with DynComp.
Examples of errors that you may obtain when using the wrong version of the JDK include the following:
Error occurred during initialization of VM
java.lang.UnsatisfiedLinkError:
# A fatal error has been detected by the Java Runtime Environment:
#
#  SIGSEGV
When running DynComp, an exception similar to the following:
Exception in thread "main" java.lang.AbstractMethodError:
    example1c$$Lambda$5/1722023916.sayHello(Ldaikon/dcomp/DCompMarker;)Ljava/lang/String;
probably means that sayHello is the method of an functional
interface that has not been annotated with @FunctionalInterface.
Previous: Troubleshooting DynComp for Java, Up: DynComp for Java [Contents][Index]
This is relevant to frameworks such as JUnit that call code reflectively.
If you want to run tests using JUnit, then explicitly create a Suite that
contains the tests you want to run, rather than annotating methods with
@Test and depending on JUnit to find them and call them via reflection.
If you are generating JUnit test suites with
Randoop, then supply the
--junit-reflection-allowed=false command-line option to Randoop.
Programs that are run via JUnit often benefit from using --ppt-omit-pattern=org.junit as an option to Chicory (and DynComp). This avoids inferring invariants about the JUnit library, which are almost always uninteresting.
clone() method may fail on particular
invocations within private classes in the JDK.
Next: Celeriac, Previous: DynComp for Java, Up: Front ends and instrumentation [Contents][Index]
Daikon’s front end for C and C++, named Kvasir, executes C and C++ programs and creates data trace (.dtrace) files of variables and their values by examining the operation of the binary at run time. Kvasir is named after the Norse god of knowledge and beet juice. It is built upon the Fjalar dynamic analysis framework for C and C++ programs (available at http://groups.csail.mit.edu/pag/fjalar/, but already included in the Daikon distribution).
To use Kvasir, first compile your program using either the DWARF-2 or DWARF-3 debugging
format (e.g., supply the -gdwarf-3 option to gcc) and
without optimizations (e.g., supply the -O0 option to gcc).
Also, some versions of gcc now output position independent code by default.
Kvasir cannot properly process these binaries.
You must add the -no-pie option to disable this feature.
Note that if your build system separates the compile and link steps, the
-no-pie option needs to be on the link step.
Then, prefix your command line by kvasir-dtrace. For example,
if you normally run your program with the command
./program -option input.file
then instead use the command
kvasir-dtrace ./program -option input.file
to run your program and create a data trace file daikon-output/program.dtrace, which can be fed as input into Daikon. You can perform this step multiple times to create multiple data trace files for Daikon. You can also run Daikon without creating an intermediate data trace file; see Online execution.
For information about installing Kvasir, see Installing Kvasir. Kvasir only works under Linux running on an x86-64 processor (also known as an amd64 processor); for full details, see Kvasir limitations. When you run Kvasir, if you get a message of the form:
valgrind: failed to start tool 'fjalar' for platform 'x86-linux': No such file or directory
it indicates that your program is not an x86-64 binary. See Running Kvasir on i386 binaries for information on how to run Kvasir on an i386 compatible binary. For information about how to create an instrumenter for C that works on non-Linux or non-x86 platforms, see Instrumenting C programs in Daikon Developer Manual.
Next: Kvasir options, Up: Kvasir [Contents][Index]
Before using Kvasir, you must compile your program compile and link your program normally, with two exceptions:
gcc default DWARF output level is now 5.
Therefore, you must supply the -gdwarf-2 or -gdwarf-3 command line option.
In the second step of using Kvasir, run your program as you normally
would, but prepend the command kvasir-dtrace to the beginning.
For instance, if you normally run your program with the command
./myprogram -option input.file
just say
kvasir-dtrace ./myprogram -option input.file
As well as running your program (more slowly than usual), this command also creates a directory daikon-output in the current directory containing a program.dtrace file suitable as input to Daikon.
Kvasir’s first argument, the program name, should be given as a pathname, as shown above. If you usually just give a program name that is not in the current directory but is found in your path, you may need to modify your command to specify a pathname. For example:
kvasir-dtrace `which myprogram` -option input.file
You may supply options to Kvasir before the argument that is the name of your program (see Kvasir options).
Next: DynComp for C/C++, Previous: Using Kvasir, Up: Kvasir [Contents][Index]
To see a complete list of options, run this command: kvasir-dtrace --help
Output file format:
Write the .decls file listing the names of functions and variables (called declarations) to the specified file name. This forces Kvasir to generate separate .decls and .dtrace files instead of outputting everything to the .dtrace file, which is the default behavior. If only a .dtrace file is created (default behavior), then it contains both variable declarations and a trace of values. If separate .decls and .dtrace files are created, then the .decls file contains declarations and the .dtrace file contains the trace of values. Note that while Kvasir will accept any valid value for filename, it must contain .decls to be recognized by Daikon.
Exit after writing the .decls file; don’t run the program or generate trace information. Since the .decls file is the same for any run of a program, it can be generated once and then reused on later runs, as long as no new program points are added and each program point has the same set of variables.
Write the .dtrace trace file to the specified file name. The default is daikon-output/programname.dtrace, where programname is the name of the program. A filename of - may be used to specify the standard output; in this case, the regular standard output of the program will be redirected back to the terminal (/dev/tty), to avoid intermixing it with the trace output. If the given filename ends in .gz, then --dtrace-gzip is enabled and the .dtrace file will be compressed. Note that while Kvasir will accept any valid value for filename, it must contain .dtrace to be recognized by Daikon.
By default, the .dtrace file contains both a list of variable declarations followed by a trace of variable values (see File formats in Daikon Developer Manual). If this option is used, then variable declarations are not outputted in the .dtrace file. This option is equivalent to --decls-file=/dev/null, except that it runs faster. This is useful when you want to generate one copy of the declarations in the .decls file using --decls-only, generate many .dtrace files from different program runs, and then feed 1 .decls and several .dtrace files into Daikon.
Append new trace information to the end of an existing .dtrace file. The default is to overwrite a preexisting .dtrace file. When this option is used, no declaration information is written because it is assumed that the existing .dtrace file already contains all declarations (Daikon does not accept duplicate declarations).
Compress trace information with the gzip program before writing
it to the .dtrace file. You must have the gzip program
available.
Create the output .dtrace file as a FIFO (also known as a named pipe). Kvasir will then open first the .decls FIFO and then the .dtrace FIFO, blocking until another program (such as Daikon) reads from them. Using FIFO files for the output of Kvasir avoids the need for large trace files, but FIFO files are not supported by some file systems, including the Andrew File System (AFS).
Redirect the standard output (respectively, standard error) stream of the
program being traced to the specified path. By default, the standard
output and standard error streams will be left pointing to the same
locations specified by the shell, except that if --dtrace-file=-
is specified, then the default behavior is as if
--program-stdout=/dev/tty were specified, since mixing the
program’s output and Kvasir’s trace output is not advisable.
If the same filename is given for both options, the streams will be
interleaved in the same way as if by the Bourne shell construction
2>&1.
Also, as in the shell, filename can be an ampersand followed by an integer, to redirect to a numbered file descriptor. For instance, to redirect the program’s standard output and error, and Kvasir’s standard error, to a single file, you can say --program-stdout='&2' --program-stderr='&2' 2>filename.
Selective program point and variable tracing:
Trace only the program points (respectively, variables) listed in the given file. Other program points (respectively variables) will be omitted from the .decls and .dtrace files. A convenient way to produce such files is by editing the output produced by the --dump-ppt-file (respectively, --dump-var-file) option described below (see Tracing only part of a program).
Print a list of all the program points (respectively all the variables) in the program to the specified file. An edited version of this file can then be used with the --ppt-list-file (respectively --var-list-file) option (see Tracing only part of a program). Note: You must use these options with the --no-dyncomp option because otherwise, the behavior is undefined. Running Kvasir with these options will initialize but not actually execute the target program, so the dynamic comparability analysis cannot be performed in the first place.
Omit any global or static variables from the .decls and .dtrace files. Leaving these out can significantly improve Kvasir and Daikon’s performance, at the expense of missing properties involving them. The default is to generate trace information for global and static variables.
Omit any static variables but generate trace information for global variables in the .decls and .dtrace files.
Output all static variables at all program points in the .decls and .dtrace files. By default, file-static variables are only outputted at program points for functions that are defined in the same file (compilation unit) as the variable, and static variables declared within a particular function are only outputted at program points for that function. These heuristics decrease clutter in the output without greatly reducing precision because functions have no easy way of modifying variables that are not in-scope, so it is often not useful to output those variables. This option turns off these heuristics and always outputs static variables at all program points.
Other options affecting the amount of output Kvasir produces:
Enables printing of object program points for C/C++ structs and C++ classes. See Program points for more information.
This option forces the flattening of statically-sized arrays into
separate variables, one for each element. For example, an array
foo of size 3 would be flattened into 3 variables: foo[0],
foo[1], foo[2]. By default, Kvasir flattens
statically-sized arrays only after it has already exhausted the one
level of sequences that Daikon allows in the .dtrace output format
(e.g. an array of structs where each struct contains a statically-sized
array).
Only visit at most the first N elements of all arrays. This can improve performance at the expense of losing coverage; it is often useful for tracing selected parts of programs that use extremely large arrays or memory buffers.
This option forces Kvasir to output .decls and .dtrace entries for struct variables. By default, Kvasir ignores struct variables because there is really no value that can be meaningfully associated with these variables. However, some tools require struct variables to be outputted, so we have included this option. Struct variables are denoted by a ‘# isStruct=true’ annotation in their declarations.
For recursively-defined structures (structs or classes with members that are structs or classes or pointers to structs or classes of any type), N (an integer between 0 and 100) specifies approximately how many levels of pointers to dereference. This is useful for controlling the output of complex data structures with many references to other structures. The default is 2.
For recursively-defined structures (structs or classes with members that are pointers to the same type of struct or class), N (an integer between 0 and 100) specifies approximately how many levels of pointers to dereference. This is useful for controlling the output of linked lists and trees. The default is 4. If you are trying to traverse deep into data structures, try adjusting the --struct-depth and --total-depth options until Kvasir traverses deep enough to reach the desired variables.
Specifies the name of the pointer type disambiguation file (see Pointer type disambiguation). If this file exists, Kvasir uses it to make decisions about how to output the referents of pointer variables. If the file does not exist, then Kvasir creates it. This file may then be edited and used on subsequent runs. This option initializes but does not fully execute the target program (unless it is run with the --smart-disambig option).
Tells Kvasir to create or read pointer type disambiguation (see Pointer type disambiguation) with the default filename, which is myprog.disambig in the same directory as the target program, where myprog is the name of the target program. This is equivalent to --disambig-file=myprog.disambig.
This option should be used in addition to either the --disambig or --disambig-file options (it does nothing by itself). If the .disambig file specified by the option does not exist, then Kvasir executes the target program, observes whether each pointer refers to either one element or an array of elements, and creates a disambiguation file that contains suggestions for the disambiguation types of each pointer variable. This potentially provides more accuracy than using either the --disambig or --disambig-file options alone, but at the expense of a longer run time. (If the .disambig file already exists, then this option provides no extra functionality.)
By default, Kvasir treats all pointers as arrays when outputting their contents. This option forces Kvasir to treat function parameters and return values that are pointers as pointing to single values. However, all pointers nested inside of data structures pointed-to by parameters and return values are still treated as arrays. This is useful for outputting richer data information for functions that pass parameters or return values via pointers, which happens often in practice.
By default, Kvasir treats all pointers as arrays when outputting their contents. This option forces Kvasir to treat all pointers as pointing to single values. This is useful when tracing nested structures with lots of pointer fields which all refer to one element.
Run Kvasir with the DynComp dynamic comparability analysis tool to determine which variables have the same abstract type. (This is the default behavior for Kvasir and it is not necessary to specify this option.) Variable comparability information improves the performance of Daikon and improves Daikon’s output by filtering out irrelevant invariants. Because it is not available until the end of execution, comparability information is always written to a separate .decls file (in the format specified in the Program point declarations in Daikon Developer Manual), as if the --decls-file option had been specified (--decls-file can still be used to control the name of the file). This file must be provided to Daikon along with the .dtrace file. This option may also be used with --decls-only to only generate a .decls file without a .dtrace.
Note that if you are running multiple runs (executions) of your test program and you are certain that the comparability information will not vary from run to run, you may use --no-dyncomp on the second and subsequent runs to reduce the time required to generate the .trace file(s).
By default, DynComp considers any binary operation as an interaction between its two operands. (=all)
You may restrict this such that the only binary operations that qualify as interactions are comparisons, addition, subtraction. This ensures that the variables that DynComp groups together into one set all have the same units (e.g., physics units). (=units)
A tighter restriction is to stipulate that the only binary operations that
qualify as interactions are comparisons between values (e.g., x <=
y or x != y). (=comparisons)
Finally, you may specify that no binary operations qualify as interactions between values. Thus, DynComp only tracks dataflow. (=none)
This option applies an approximation for handling literal values which greatly speeds up the performance of DynComp and drastically lowers its memory usage, but at the expense of a slight loss in precision of the generated comparability sets. If you cannot get DynComp to successfully run on a large program, even after tweaking --dyncomp-gc-num-tags, try turning on this option.
This option runs a more detailed (but more time- and space-intensive) algorithm for tracking variable comparability. It takes O(n^2) time and space, whereas the default algorithm takes roughly O(n) time and space. However, it can produce more precise results. Despite its name, this mode can be used together with --dyncomp-fast-mode to run the more precise algorithm but still use an approximation for handling literal values. (This mode is still experimental and not well-tested yet.)
The default behavior for DynComp is to generate the same comparability numbers for Daikon variables at each pair of function entrance and exit program points. If this option is used, then DynComp keeps track of comparability separately for function entrances and exits, which can lead to more accurate results, but sometimes generates output .decls files that Daikon cannot accept.
By default, DynComp runs a garbage collector for the tag metadata once after every 10,000,000 tags have been assigned. This option tells the garbage collector to run once after every N tags have been assigned. Making the value of N larger allows your program to run faster (because the garbage collector runs less frequently), but may cause your program to run out of memory as well. Making the value of N too small may cause your program to never terminate if N is smaller than the total number of tags that your program uses in steady state. You will probably need to experiment with tweaking this value in order to get DynComp to work properly.
Making the value of N equal to 0 turns off the garbage collector. This may reduce your program’s execution time; however, it is not recommended for long program runs, because without the garbage collector, it will likely run out of memory.
Debugging:
Outputs a representation of data structures, functions, and variables in the target program to an XML file in order to aid in debugging. These are all the entities that Kvasir tracks for a particular run of a target program, so if you do not see an entity in this XML file, then you should either adjust command-line options or contact us with a bug report.
This pauses the program’s execution in an infinite loop during
initialization. You can attach a debugger such as gdb to the
running process by running gdb on inst/lib/valgrind/fjalar-amd64-linux under
the Kvasir directory and using the attach command.
Enable progress messages meant for debugging problems with Kvasir, Fjalar, or DynComp. By default, they are disabled. This option is intended mainly for Kvasir’s developers.
Enables trace messages to be output to stderr. These are disabled by
default. These options are intended mainly for DynComp developers.
Next: Tracing only part of a program, Previous: Kvasir options, Up: Kvasir [Contents][Index]
By default, Kvasir outputs both a .dtrace file that contains value traces, and a .decls file with variable comparability information that was produced by the DynComp tool. You can run Daikon on just the .dtrace file without the DynComp variable comparability information, but doing so is strongly discouraged.
The DynComp dynamic comparability analysis tool performs dynamic type inference to group variables at each program point into comparability sets. (See Program point declarations in Daikon Developer Manual, for the file representation format of these sets.) All variables in each comparability set belong to the same “abstract type” of data that the programmer likely intended to represent, which is a richer set of types than the few basic declared types (e.g., int, float) provided by the language. Consider the example below:
int main() {
  int year = 2005;
  int winterDays = 58;
  int summerDays = 307;
  compute(year, winterDays, summerDays);
}

int compute(int yr, int d1, int d2) {
  if (yr % 4)
    return d1 + d2;
  else
    return d1 + d2 + 1;
}
The three variables in main() all have the same C representation
type, int, but two of them hold related quantities (numbers of
days), as can be determined by the fact that they interact when the
program adds them, whereas the other contains a conceptually distinct
quantity (a year). The abstract types “day” and “year” are both
represented as int, but DynComp can differentiate them with its
dynamic analysis. For example, DynComp can infer that winterDays
and summerDays are comparable (belong to the same abstract type)
because the program adds their values together within the
compute() function.
Without comparability information, Daikon attempts to find invariants
over all pairs (and sometimes triples) of variables present at every
program point. This can lead to two negative consequences: First, it
may take lots of time and memory to infer all of these invariants,
especially when there are many global or derived variables present.
Second, many of those invariants are true but meaningless because they
relate variables which conceptually represent different types (e.g., an
invariant such as winterDays < year is true but meaningless
because days and years are not comparable).
By default, Kvasir runs with DynComp to generate a .decls file with comparability information along with the usual value trace in the .dtrace file. Using --decls-only will only generate the .decls file without the extra slowdown of writing the .dtrace file to disk (however, because DynComp must execute the entire program to perform its analysis, the only time saved is I/O time). Other DynComp options are listed in the Kvasir options section. Running Kvasir with DynComp takes more memory and longer time than Kvasir without DynComp, but Daikon will run faster and produce better output. Furthermore, it is possible to run DynComp only once to generate a .decls file with comparability information, and pass that one file into Daikon along with many different .dtrace files generated during subsequent Kvasir runs without DynComp. You may wish to verify that your .decls file information does not vary from run to run if you choose to use this approach. The .decls-DynComp files should be identical.
Here is part of the .decls file generated by running Kvasir with DynComp on the above example:
ppt ..compute():::ENTER
  ppt-type enter
  variable yr
    var-kind variable
    rep-type int
    dec-type int
    flags is_param
    comparability 1
  variable d1
    var-kind variable
    rep-type int
    dec-type int
    flags is_param
    comparability 2
  variable d2
    var-kind variable
    rep-type int
    dec-type int
    flags is_param
    comparability 2

ppt ..compute():::EXIT0
  ppt-type subexit
  variable yr
    var-kind variable
    rep-type int
    dec-type int
    flags is_param
    comparability 1
  variable d1
    var-kind variable
    rep-type int
    dec-type int
    flags is_param
    comparability 2
  variable d2
    var-kind variable
    rep-type int
    dec-type int
    flags is_param
    comparability 2
  variable return
    var-kind variable
    rep-type int
    dec-type int
    comparability 2
The abstract type of “year” (and its corresponding comparability set) is
represented by the number 1 while the abstract type of “day” is
represented by the number 2. DynComp places two variables in the same
comparability set when their values interact via program operations such
as arithmetic or assignment. Because the parameters d1 and
d2 were added together, DynComp inferred that those variables
were somehow related and put them in the same comparability set. The
return value is also related to d1 and d2 because it is
the result of the addition operation. Notice that yr never
interacts with any other variables, so DynComp places it into its own
comparability set. With this comparability information, Daikon will
never attempt to find invariants between yr and
d1/d2, which both saves time and memory and eliminates
meaningless invariants (the savings are minuscule in this trivial
example, but they can be rather dramatic in larger examples).
Next: Pointer type disambiguation, Previous: DynComp for C/C++, Up: Kvasir [Contents][Index]
When Kvasir is run on a target program of significant size, often times too much output is generated, which causes an enormous performance slowdown of both Kvasir outputting the trace file and also Daikon trying to process the trace file. It is often desirable to only trace a specific portion of the target program, program points and variables that are of interest for a particular invariant detection application. For instance, one may only be interested in tracking changes in a particular global data structure during calls to a specific set of functions (program points), and thus have no need for information about any other program points or variables in the trace file. The --ppt-list-file and --var-list-file options can be used to achieve such selective tracing.
The program point list file (abbreviated as ppt-list-file)
consists of a newline-separated list of names of functions that the
user wants Kvasir to trace. Every name corresponds to both the entrance
(:::ENTER) and exit (:::EXIT) program points for that function
and is printed out in the exact same format that Kvasir
uses for that function in the trace file. (See Using Kvasir,
for the program point naming scheme.) Here is an
example of a ppt-list-file:
FunctionNamesTest.cpp.staticFoo(int, int)
..firstFileFunction(int)
..main()
second_file.cpp.staticFoo(int, int)
..secondFileFunction()
It is very important to follow this format in the ppt-list-file
because Kvasir performs string comparisons to determine which program
points to trace. Thus, it is often easier to have Kvasir generate a
ppt-list-file file that contains a list of all program points in a
target program by using the --dump-ppt-file option, and then
either comment out (by using the ‘#’ comment character at the
beginning of the line) or delete lines in that file for program points
not to be traced or create a new ppt-list-file using the names in
the Kvasir-generated file. This prevents typos and the tedium of
manually typing up program point names. In fact, the ppt-list-file
presented in the above example was generated from a C++ test program named
FunctionNamesTest by using the following command:
kvasir-dtrace --dump-ppt-file=FunctionNamesTest.ppts \
              ./FunctionNamesTest
That file represents all the program points that Kvasir would
normally trace. If the user wanted to only trace the main()
function, he could comment out all other lines by placing a single
‘#’ character at the beginning of each line to be commented out,
as demonstrated here:
#FunctionNamesTest.cpp.staticFoo(int, int)
#..firstFileFunction(int)
..main()
#second_file.cpp.staticFoo(int, int)
#..secondFileFunction()
When running Kvasir with the --ppt-list-file option using this
as the ppt-list-file, Kvasir only stops the execution of the target program at the
entrance and exit of main() in order to output values to the
.dtrace file. In order to reduce the file size, when running Kvasir
with the --ppt-list-file option, the .decls file only contains
program point declarations for those listed in the ppt-list-file
(..main():::ENTER and ..main():::EXIT in this case) because
no other declarations are necessary.
The variable list file (abbreviated as var-list-file) contains all of the variables that the user wants Kvasir to output. There is one section for global variables and a section for variables associated with each function (formal parameters and return values). Again, the best way to create a var-list-file is to have Kvasir generate a file with all variables using the --dump-var-file option and then modifying that file for one’s particular needs by either deleting or commenting out lines (again using the ‘#’ comment character). For example, executing
kvasir-dtrace --dump-var-file=FunctionNamesTest.vars \
              ./FunctionNamesTest
will generate the following var-list-file named
FunctionNamesTest.vars:
----SECTION----
globals
/globalIntArray
/globalIntArray[]
/anotherGlobalIntArray
/anotherGlobalIntArray[]


----SECTION----
FunctionNamesTest.cpp.staticFoo()
x
y


----SECTION----
..firstFileFunction(int)
blah


----SECTION----
..main()
argc
argv
argv[]
return


----SECTION----
second_file.cpp.staticFoo()
x
y


----SECTION----
..secondFileFunction()
The file format is straightforward. Each section is marked by a
special string ‘----SECTION----’ on a line by itself followed
immediately by a line that either denotes the program point name
(formatted like how it appears in the .decls and .dtrace files) or the
special string ‘globals’. This is followed by a
newline-delimited list of all variables to be outputted for that
particular program point. Global variables listed in the
globals section are outputted for all program points. Additional global
variables to be outputted for a particular program point can be specified
in the corresponding section entry. For clarity, one or more blank lines
should separate neighboring sections, although the ‘----SECTION----’
string literal on a line by itself is the only required delimiter.
If an entire section is missing, then no variables for that program point
(or no global variables, if it is the special globals section) are traced.
The variables listed in this file are written exactly as they appear in
the .decls and .dtrace file. (See Using Kvasir,
for the variable naming scheme.) In the program that generated the
output for the above example, int*
globalIntArray is a global integer pointer variable. For that
variable, Kvasir generates two Daikon variables: /globalIntArray
to represent the hashcode pointer value, and /globalIntArray[] to
represent the array of integers referred-to by that pointer. The
latter is a derived-variable that can be thought of as the child of
/globalIntArray. If the entry for /globalIntArray is
commented-out or missing, then Kvasir will not output any values for
/globalIntArray or for any of its children, which in this case is
/globalIntArray[]. If a struct or struct pointer variable is
commented-out or missing, then none of its members are traced. Thus, a
general rule about variable entries in the var-list-file is that
if a parent variable is not present, then neither it nor its children
are traced.
record
record->entries[1]
record->entries[1]->list
record->entries[1]->list->head
record->entries[1]->list->head->magic
For example, if you wanted to trace the value of the magic field
nested deep within several layers of structs and arrays, it would not be
enough to merely list this variable in the var-list-file. You
would need to list all variables that are the parents of this one, as
indicated by their names. This can be easily accomplished by creating a
file with --dump-var-file and cutting out variable entries,
taking care to not cut out entries that are the parents of entries that
you want to trace.
In order to limit both the number of program points traced as well as the variables traced at those program points, the user can run Kvasir with both the --ppt-list-file and --var-list-file options with the appropriate ppt-list-file and var-list-file, respectively. The var-list-file only needs to contain a section for global variables and sections for all program points to be traced because variable listings for program points not to be traced are irrelevant (their presence in the var-list-file does not affect correctness but does cause an unnecessary performance and memory inefficiency).
If the --dump-var-file option is used in conjunction with the --ppt-list-file option, then the only sections generated in the var-list-file will be the global section and sections for all program points explicitly mentioned in the ppt-list-file. This is helpful for generating a smaller var-list-file for use with an already-existent ppt-list-file.
Next: C++ support, Previous: Tracing only part of a program, Up: Kvasir [Contents][Index]
Kvasir permits users (or external analyses) to specify whether pointers refer to arrays or to single values, and optionally, to specify the type of a pointer (see Pointer type coercion). For example, in
void sum(int* array, int* result) { ... }  // definition of "sum"
...
int a[40];
int total;
...
sum(a, &total);        // use of "sum"
the first pointer parameter refers to an array while the second refers to
a single value. Kvasir (and Daikon) should treat these values
differently. For instance, *array is better printed as array[],
an array of integers, and result[] isn’t a sensible array
at all, even though in C result[0] is semantically identical to
*result.
By default, Kvasir treats all pointers as referencing arrays. For
instance, it would print result[] rather than result[0]
and would indicate that the length of array result[] is always 1.
In order to improve the formatting of Daikon’s output (and to speed it
up), you can indicate to Kvasir that certain pointers refer to single
elements rather than to arrays.
For an example, see Pointer type disambiguation example.
For a list of command-line options that are related to pointer type
disambiguation, see Pointer type disambiguation command-line arguments.
Information about whether each pointer refers to an array or a single element can be specified in a .disambig file that resides in the same directory as the target program (by default). The --disambig option instructs Kvasir to read this file if it exists. (If it does not exist, Kvasir produces the file automatically and, if invoked along with the --smart-disambig option, heuristically infers whether each pointer variable refers to single or multiple elements. Thus, users can edit this file for use on subsequent runs rather than having to create it from scratch.) The .disambig file lists all the program points and user-defined types, and under each, lists certain types of variables along with their custom disambiguation types as shown below. The list of disambiguation options is:
char and unsigned char:
char and unsigned for unsigned char. (Default)
char and unsigned char:
The .disambig file that Kvasir creates contains a section for each function, which can be used to disambiguate parameter variables visible at that function’s entrance program point and parameter and return value variables visible at that function’s exit program point. It also contains a section for every user-defined struct/class, which can be used to disambiguate member variables of that struct/class. Disambiguation information entered here will apply to all instances of a struct/class of that type, at all program points. There is also a section called “globals”, which disambiguates global variables which are output at every program point. The entries in the .disambig file may appear in any order, and whole entries or individual variables within a section may be omitted. In this case, Kvasir will retain their default values.
| • Pointer type coercion | ||
| • Pointer type disambiguation example | ||
| • Using pointer type disambiguation with partial program tracing |
In addition to specifying whether a particular pointer refers to one
element or to an array of elements, the user can also specify what type
of data a pointer refers to. This type coercion acts like an explicit
type cast in C, except that it only works on struct/class types and not
on primitive types. This feature is useful for traversing inside of
data structures with generic void* pointer fields. Another use
is to cast a pointer from one that refers to a “super class” to one that
refers to a “sub class”. This structural equivalence pattern is often
found in C programs that emulate object orientation. To coerce a
pointer to a particular type, simply write the name of the struct type
after the disambiguation letter (e.g., A, P, S, C, I) in the
.disambig file:
----SECTION----
function: ..view_foo_and_bar()
f
P foo
b
P bar
Without the type coercion, Kvasir cannot print out anything except for a
hashcode for the two void* parameters of this function:
void view_foo_and_bar(void* f, void* b);
With type coercion, though, Kvasir treats f as a foo* and
b as bar* and can traverse inside of them. Of course, if
those are not the true run-time types of the variables, then Kvasir’s
output will be meaningless.
Due to the use of typedefs, there may be more than one name for a
particular struct type. The exact name that you need to write in the
.disambig file is the one that appears in that file after the
usertype prefix. Note that if a struct does not have any pointer
fields, then there will be no usertype section for it in the
.disambig file. In that case, try different names for the struct
if necessary until Kvasir accepts the name (names are all one word long;
you will never have to write struct foo). There should only be
at most a few choices to make. If the coercion if successful, Kvasir
prints out a message in the following form while it is processing the
.disambig file:
.disambig: Coerced variable f into type 'foo'
.disambig: Coerced variable b into type 'bar'
One more caveat about type coercion is that you can currently only coerce pointers into types that at least one variable in the program (e.g., globals, function parameters, struct fields) belongs to. It is not enough to merely declare a struct type in your source code; you must have a variable of that type somewhere in your program. This is a limitation of the current implementation, but it should not matter most of the time because programs rarely have struct declarations with no variables that belong to that type. If you encounter this problem, you can simply create a global variable of a certain type to make type coercion work.
Next: Using pointer type disambiguation with partial program tracing, Previous: Pointer type coercion, Up: Pointer type disambiguation [Contents][Index]
This example demonstrates the power of pointer type disambiguation in creating more accurate Daikon output. Consider this file:
struct record {
  char* name;     // Initialize to: "Daikon User"
  int numbers[5]; // Initialize to: {5, 4, 3, 2, 1}
};

void foo(struct record* bar) {
  int i;
  for (i = 0; i < 5; i++) {
    bar->numbers[i] = (5 - i);
  }
}

int main() {
  char* myName = "Daikon User";
  struct record baz;
  baz.name = myName;
  foo(&baz);
}
In foo(), bar is a pointer to a record struct. By inspection, it is
evident that in this program, bar only refers to one element: &baz
within main. However, by default, Kvasir assumes that bar is an
array of record structs since a C pointer contains no information about
how many elements it refers to. Because Kvasir must output bar as an
array and bar->numbers is an array of integers, it “flattens”
bar->numbers into 5 separate arrays named bar->numbers[0]
through bar->numbers[4]
and creates fairly verbose output. This is a direct
consequence of the fact that Daikon can only handle one layer of sequences
(it cannot handle arrays within arrays, i.e., multidimensional arrays).
Here is part of the Daikon output for this program:
======================================================================
..foo():::ENTER
bar has only one value
bar[].name == [Daikon User]
bar[].name elements == "Daikon User"
======================================================================
..foo():::EXIT
size(bar[]).numbers[0] == size(bar[]).numbers[0][0]
size(bar[]).numbers[0] == size(bar[]).numbers[1]
size(bar[]).numbers[0] == size(bar[]).numbers[1][0]
size(bar[]).numbers[0] == size(bar[]).numbers[2]
size(bar[]).numbers[0] == size(bar[]).numbers[2][0]
size(bar[]).numbers[0] == size(bar[]).numbers[3]
size(bar[]).numbers[0] == size(bar[]).numbers[3][0]
size(bar[]).numbers[0] == size(bar[]).numbers[4]
size(bar[]).numbers[0] == size(bar[]).numbers[4][0]
bar[].name == [Daikon User]
bar[].name elements == "Daikon User"
bar[].numbers[0] contains no nulls and has only one value, of length 1
bar[].numbers[0] elements has only one value
bar[].numbers[0][0] == [5]
bar[].numbers[0][0] elements == 5
bar[].numbers[1] contains no nulls and has only one value, of length 1
bar[].numbers[1] elements has only one value
bar[].numbers[1][0] == [4]
bar[].numbers[1][0] elements == 4
bar[].numbers[2] contains no nulls and has only one value, of length 1
bar[].numbers[2] elements has only one value
bar[].numbers[2][0] == [3]
bar[].numbers[2][0] elements == 3
bar[].numbers[3] contains no nulls and has only one value, of length 1
bar[].numbers[3] elements has only one value
bar[].numbers[3][0] == [2]
bar[].numbers[3][0] elements == 2
bar[].numbers[4] contains no nulls and has only one value, of length 1
bar[].numbers[4] elements has only one value
bar[].numbers[4][0] == [1]
bar[].numbers[4][0] elements == 1
size(bar[]).numbers[0] == 1
bar[].numbers[4][0] elements == size(bar[]).numbers[0]
size(bar[]).numbers[0] in bar[].numbers[4][0]
This is a bit verbose due to the fact that Kvasir treats bar like an array
by default when it actually only points to one element. However, by running
Kvasir with the --disambig option, we create the
myprog.disambig file, which we can then edit and feed back to
Kvasir to change how the pointer is treated. (We run Kvasir twice on the same
program, but we edit the .disambig file in between the runs.)
kvasir-dtrace ...options... --disambig --smart-disambig myprog
This creates the myprog.disambig file. It contains, at the top:
----SECTION----
function: ..foo()
bar
P
This means that at the program points corresponding to the entry and
exit of foo(), the variable bar is treated as a
‘Pointer’ type.
Since we have used the --smart-disambig option,
Kvasir automatically inferred Pointer instead of Array for bar
because it observed that bar only pointed to one element during the
execution of the target program which generated the .disambig file.
This heuristic allows users to use
.disambig files more effectively with less manual editing.
Without --smart-disambig, Kvasir does not execute the program
to make such inferences, which allows .disambig files to be generated
faster, but leaves the default disambiguation types for all entries (in
this case, bar would have the default array type of
'A').
Then, running Kvasir again with the --disambig option causes Kvasir to open the existing myprog.disambig file, read the definitions, and alter the output accordingly:
kvasir-dtrace ...options... --disambig myprog
This tells Kvasir to output bar as a ‘Pointer’ to a single
element, which in turn causes Daikon to generate a much more concise
set of invariants. Notice that bar->numbers no longer has to be
“flattened” because bar is now a pointer to one struct, so
Daikon can recognize bar->numbers as a single-dimensional
array (Daikon uses a Java-like syntax, replacing the arrow ‘->’ symbol
with a dot, so it actually outputs bar.numbers).
======================================================================
..foo():::ENTER
bar has only one value
bar.name == "Daikon User"
======================================================================
..foo():::EXIT
bar.name == "Daikon User"
bar.numbers has only one value
bar.numbers[] == [5, 4, 3, 2, 1]
size(bar.numbers[]) == 5
bar.name == orig(bar.name)
size(bar.numbers[]) in bar.numbers[]
size(bar.numbers[])-1 in bar.numbers[]
Previous: Pointer type disambiguation example, Up: Pointer type disambiguation [Contents][Index]
It is possible to use pointer type disambiguation while only tracing selected program points and/or variables in a target program, combining the functionality described in the Pointer type disambiguation and Tracing only part of a program sections. This section describes the interaction of the ppt-list-file, var-list-file, and .disambig files.
The interaction between selective program point tracing (via the ppt-list-file) and pointer type disambiguation is fairly straightforward: If the user creates a .disambig file while running Kvasir with a ppt-list-file that only specifies certain program points, the generated .disambig file will only contain sections for those program points (as well as the global section and sections for each struct type). If the user reads in a .disambig file while running Kvasir with a ppt-list-file, then disambiguation information is applied for all variables at the program points to be traced. This can be much faster and generate a much smaller disambiguation file, one that only contains information about the program points of interest.
The interaction between selective variable tracing (via the
var-list-file) and pointer type disambiguation is a bit more
complicated. This is because the var-list-file lists variables
as they appear in the .decls and .dtrace files, but using a .disambig
file can actually change the way that variable names are printed out in
the .decls and .dtrace files. For example, consider the test program
from the Pointer type disambiguation example. The struct
record* bar parameter of foo() is treated like an array by
default. Hence, the .decls, .dtrace, and var-list-file will list
the following variables derived from this parameter:
----SECTION----
..foo()
bar
bar[].name
bar[].numbers[0]
bar[].numbers[0][0]
bar[].numbers[1]
bar[].numbers[1][0]
bar[].numbers[2]
bar[].numbers[2][0]
bar[].numbers[3]
bar[].numbers[3][0]
bar[].numbers[4]
bar[].numbers[4][0]
However, if we use a disambiguation file to denote bar as a
pointer to a single element, then the .decls and .dtrace files will
instead list the following variables:
----SECTION----
..foo()
bar
bar->name
bar->numbers
bar->numbers[]
Notice how the latter variable list is more compact and reflects the
fact that bar is a pointer to a single struct. Thus, the
flattening of the numbers[5] static array member variable is no
longer necessary (it was necessary without disambiguation because Daikon
does not support nested arrays of arrays, which can occur if bar
were itself an array since numbers[5] is already an array).
Notice that, with the exception of the base variable bar, all
other variable names differ when running without and with
disambiguation. Thus, if you used a var-list-file generated on a
run without the disambiguation information while running Kvasir with the
disambiguation information, the names will not match up at all, and you
will not get the proper selective variable tracing behavior.
The suggested way to use selective variable tracing with pointer type disambiguation is as follows:
For maximum control of the output, you can use selective program point tracing, variable tracing, and disambiguation together all at once.
Next: Online execution, Previous: Pointer type disambiguation, Up: Kvasir [Contents][Index]
Kvasir supports C++, but Kvasir has been tested more on C programs than on C++ programs, so Kvasir’s C++ support is not as mature as its C support. Here is a partial list of C++ features that Kvasir currently supports:
this) to a single
instance of the class. They are printed with the class name as the
prefix, followed by a period and then the full function signature. For
example, a push() function of a Stack class might be named
Stack.push(char*).
this parameter.
this is an instance of a class that inherits from
another class called fooClass which has a member variable
fooVar, then Kvasir prints out fooVar as
this->fooClass.fooVar. This correctly handles the case of
multiple inheritance as well as several layers of inheritance. Thus,
object invariants capture properties of a class’s own member variables
as well as those of its superclasses’ member variables.
foo() will be
disambiguated by their signatures, such as foo(int, int) and
foo(double, double).
One current C++ limitation is that Kvasir cannot print out the contents
of classes which are defined in external libraries rather than in the
user’s program (e.g., it can properly output a C-string represented as
char* but not the contents of the C++ string class). If
further support for specific C++ features are important to you, please
send email to daikon-developers@googlegroups.com, so that we
can increase its priority on our to-do list.
Next: Installing Kvasir, Previous: C++ support, Up: Kvasir [Contents][Index]
The term online execution refers to running Daikon at the same time as the target program, without writing any information to a file. This can avoid some I/O overhead, prevent filling up your disk with files, and in the future Daikon may be able to produce partial results as the target program is executing. A limitation of online execution is that, unless FIFO files, or named pipes (see Online execution with DynComp for C/C++) are used, it runs Daikon over only a single execution, as opposed to generalizing over multiple executions as can be done when writing to files and supplying all the files to Daikon. The Chicory front end for Java also supports online execution, via its --daikon-online option (see Chicory miscellaneous options).
To use regular pipes in lieu of a disk file, simply use - as the
name of the .dtrace file, and run the target program and Daikon
in a Linux pipeline.
When the --dtrace-file=- option is used to redirect
the dtrace output to stdout, the target program’s stdout is redirected
to the terminal (/dev/tty) so that it does not intermix with the
dtrace output.
kvasir-dtrace --dtrace-file=- ./bzip2 --help | $DAIKON -
Of course, you could also replace --help with -vv1 file.txt to compress a text file (but start with a small one first).
(This example assumes that you have compiled the bzip2 example (in
${DAIKONDIR}/examples/c-examples/bzip2 of the distribution) by
saying gcc -gdwarf-3 -no-pie bzip2.c -o bzip2, and that
$DAIKON stands for the command that invokes Daikon, for
instance java -Xmx7g daikon.Daikon --config_option
daikon.derive.Derivation.disable_derived_variables=true.)
Instead of a regular pipe, you can use a named pipe, also known as a FIFO, which is a special kind of file supported by most Linux-compatible systems. When one process tries to open a FIFO for reading, it blocks, waiting for another process to open it for writing (or vice-versa). When both a reader and a writer are ready, the FIFO connects the reader to the writer like a regular Linux pipe.
The --output-fifo option causes Kvasir to create its output .dtrace file as a named pipe. When Kvasir is run with this option, Daikon needs to be run at the same time to read from the FIFO, such as from another terminal or using the shell’s ‘&’ operator.
For instance, the following two commands have the same effect as the pipeline above that used ordinary pipes. The FIFO is named bzip2.dtrace.
kvasir-dtrace --output-fifo ./bzip2 --help &
$DAIKON bzip2.dtrace
The two commands (before and after the ampersand) could also be run in two different terminals.
| • Online execution with DynComp for C/C++ |
Up: Online execution [Contents][Index]
When running Kvasir with DynComp (the default), Kvasir generates the .decls file after it generates the .dtrace file, so it is not possible to perform online execution using one run. The recommended way to perform online execution with DynComp is to run it once and only generate a .decls file with comparability information, then run Kvasir again without DynComp and pipe the .dtrace data directly into Daikon while using the .decls file generated from the previous run:
kvasir-dtrace --decls-only ./foo
This should generate a .decls file with comparability information named daikon-output/foo.decls.
kvasir-dtrace --no-dyncomp --dtrace-no-decls --dtrace-file=- \
    ./foo | java -cp ${DAIKONDIR}/daikon.jar daikon.Daikon daikon-output/foo.decls -
When you run Kvasir the second time, you don’t need to run DynComp again since you are only interested in the .dtrace file. Notice that the .dtrace output is directed to standard out (--dtrace-file=-) and does not contain any declarations (--dtrace-no-decls) because the .decls file already contains the declarations. You can simply pipe that .dtrace output out to Daikon, which is invoked using the .decls file (with comparability information) generated during your previous run.
Next: Kvasir limitations, Previous: Online execution, Up: Kvasir [Contents][Index]
There are two scenarios for building the Kvasir tool:
We assume you are already familiar with the Daikon Developer Manual, in particular Compiling Daikon in Daikon Developer Manual. If that is not the case, you should read that section first.
You will need to make a clone of Fjalar’s version control repository, named fjalar, as a sibling of your Daikon clone.
cd ${DAIKONDIR}
cd ..
git clone https://github.com/codespecs/fjalar.git
You may now build Fjalar (which includes Kvasir). The following commands build Fjalar, install it locally, and make a symbolic link to it in your Daikon tree.
cd ${DAIKONDIR}
make kvasir
You may see warnings during this process. You can ignore these.
If you receive an error of the form:
readelf.c:53:17: fatal error: bfd.h: No such file or directory
#include "bfd.h"
          ^
compilation terminated.
then install the package binutils-dev.
If you receive an error of the form:
readelf.c:72:10: fatal error: zlib.h: No such file or directory
 #include <zlib.h>
          ^~~~~~~~
compilation terminated.
then install the package zlib1g-dev.
Once Kvasir has been installed, it can be used via the
kvasir-dtrace script in the ${DAIKONDIR}/scripts directory. If
you have set up the Daikon environment according to the instructions
above, it should already be in your PATH. For instructions on using
Kvasir, see Kvasir.
Next: Running Kvasir on i386 binaries, Previous: Installing Kvasir, Up: Kvasir [Contents][Index]
Kvasir is based on the Valgrind dynamic program supervision framework (which is best known for its memory error detection tool). Using Valgrind allows Kvasir to interrupt your program’s execution, read its variables, and examine its memory usage, all transparently to the program. Also, rather than using your program’s source code to find the names and types of functions and variables, Kvasir obtains them from debugging information included in the executable in a standard format (DWARF).
However, Kvasir has some limitations of its own. Because Kvasir uses Valgrind, it shares Valgrind’s processor and operating system limitations. While valgrind supports many platforms, the only one currently supported by Kvasir is amd64-linux.
x86-linux refers to Intel 386-compatible processors, also variously referred to as x86, x86-32, i386, i686, IA-32, when running under a Linux kernel in 32-bit mode. amd64-linux refers to the 64-bit extension of the x86 architecture found in many newer Intel and AMD processors, also variously referred to as x86-64, IA-32e, EM64T, and Intel 64, when running under a Linux kernel in 64-bit mode. The Itanium or IA-64 architecture is not supported.
Kvasir requires that your program have debugging information available in the DWARF-2 or DWARF-3 format. (See Using Kvasir for details.) For the best results, the programs used by Kvasir should be compiled without optimization.
This subsection lists some of the known limitations of the current Kvasir release; if you encounter any problems other than listed here, please report them as bugs (see Reporting problems). The limitations are listed roughly in decreasing order of severity.
gcc.
If feasible, we recommend that you use Kvasir with version 4.7 (or newer).
Incompatibilities
between Kvasir and the debugging information produced by older gcc
versions can lead to incorrect output and, in some cases, can cause Kvasir to crash.
Previous: Kvasir limitations, Up: Kvasir [Contents][Index]
While Kvasir only works under Linux running on an x86-64 processor, modern x86-64 Linux systems can run 32-bit applications natively thanks to the x86-64 architecture’s backward compatibility, though this support is often an optional feature rather than a default.
The following steps show how to enable 32-bit support on a recent Ubuntu Linux system. Verify you are running on a x86-64 machine:
dpkg --print-architecture
This should report amd64, if not, you cannot proceed.
See if you have 32 bit support enabled:
dpkg --print-foreign-architectures
If this reports i386, skip the next step.
Otherwise, you need to add the i386 architecture:
sudo dpkg --add-architecture i386
Next you must update your package lists. This allows your system to recognize 32-bit versions of available software:
sudo apt update
Install packages necessary for 32-bit support:
sudo apt install build-essential gcc-multilib
Finally, you now need to rebuild Kvasir to generate the i386 versions of Valgrind and Kvasir.
Go to your codespecs/fjalar repository (typically cd ${DAIKONDIR}/fjalar) and run:
make very-clean
make build
Next: dfepl, Previous: Kvasir, Up: Front ends and instrumentation [Contents][Index]
The Daikon front end for .NET languages, named Celeriac, is distributed separately; it currently supports the C#, F# and Visual Basic .NET languages. Celeriac runs the .NET program, creates data trace (.dtrace) files, and optionally runs Daikon on them. Celeriac is named after the celeriac plant, whose root may be used as an ingredient in soups or stews.
To use Celeriac, run your program as you normally would, but with the Celeriac Launcher. For instance, if you usually run
MyProgram.exe arg1 arg2 arg3
then instead you would run
CeleriacLauncher.exe celeriacArg1 celeriacArg2 MyProgram.exe arg1 arg2 arg3
This runs your program and creates the MyProgram.dtrace in the current directory. Since Celeriac instruments class files directly as they are loaded into .NET, you do not need to perform separate instrumentation and recompilation steps.
For more details about how to download and use Celeriac, please see https://github.com/codespecs/daikon-dot-net-front-end.
It should be noted that Celeriac works under Mono as well as under the Microsoft .NET implementation.
To insert Daikon-inferred invariants in C# source code as Code Contracts, use Scout (previously called Contract Inserter): https://bitbucket.org/michael.ernst/scout-contract-inserter/.
Next: convertcsv.pl, Previous: Celeriac, Up: Front ends and instrumentation [Contents][Index]
This section contains details about dfepl, the Daikon front end for
Perl. For a brief introduction to dfepl, see Perl examples and
Instrumenting Perl programs.
dfepl works with Perl versions 5.8 and later. (To be precise, Perl
programs instrumented with dfepl can also be run with Perl 5.6, but
the instrumentation engine, which is itself written in Perl, requires
version 5.8). dfepl reads the source code for Perl modules or
programs, and writes out instrumented versions of that code that
keep track of function parameters, and make calls to routines in the
daikon_runtime package whenever an instrumented subroutine is
entered or exited.
The instrumentation engine recognizes parameters as those variables
that are declared with my(...) or local(...) and, in the
same expression, assigned to from a value related to the argument
array @_, but only among the first contiguous series of such
assignments in the body of a subroutine. This will capture the most
common assignment idioms, such as my $self = shift; (where
shift is short for shift @_), my $x = $_[0];, and
my($x, $y, @a) = @_;, but the arguments to subroutines which
access them only directly through @_, or that perform other
operations before reading their arguments, will not be recognized.
If the uninstrumented code requested warnings via the use
warnings pragma or by adding the -w flag on the #!
line, the instrumented code will also request warnings. In this case,
or if -w is specified on the command line when running it, the
instrumented code may produce warnings that the original code did
not. There are several situations in which the instrumented code
produced by dfepl, while functionally equivalent to the original,
generates more warnings. The most common such problem, which arises
from code that captures the scalar-context return value of a
subroutine that returns a list, has been avoided in the current
version by disabling the warning in question. Other warnings which
are known to be produced innocuously in this way include
‘Ambiguous call resolved as CORE::foo(), qualify as such or use
&’ (caused by code that uses CORE:: to distinguish a built-in
function from a user subroutine of the same name), and ‘Constant
subroutine foo redefined’ (caused by loading both instrumented and
uninstrumented versions of a file). Though some such warnings
represent deficiencies in the instrumentation engine, they can be
safely ignored when they occur.
Because Perl programs do not contain static type information to distinguish, for instance, between strings and numbers, the Perl front end incorporates an additional dynamic analysis to infer these types. This type guessing, which occurs as a first pass before the program can be instrumented to produce output for Daikon, operates in a manner somewhat analogous to Daikon itself: watching the execution of a program, the runtime system chooses the most restrictive type for a variable that is not contradicted during that execution. These types indicate, for instance, whether a scalar value always holds an integer, a possibly fractional numeric value, or a reference to another object. It should not be necessary to examine or modify this type information directly, but for the curious, the syntax of the type information is described in comments in the Daikon::PerlType module.
The safest course is to infer types for variables using exactly the same program executions (e.g., test cases) which will later be used to generate traces for Daikon, as this guarantees that the type information will match the actual data written to the trace file. However, because the type-guessing-instrumented versions of programs run fairly slowly in the current version, you may be tempted to use a subset of the input data for type guessing. Doing so is possible, but it will only work correctly if the smaller tests exercise all of the instrumented subroutines and exit points with all the types of data they will later be used with. If the trace runtime tries to output a data value that doesn’t match the inferred type, the value may silently be converted according to Perl’s usual conventions (for instance, a non-numeric string may be treated as the number zero), or it may cause an error during tracing (for instance, trying to dereference a supposed array reference that isn’t). Also, if a subroutine exit point is traced but was never encountered during type guessing, the generated .decls and .dtrace files will be incompatible in a way that will cause Daikon to abort with an error message of the form ‘Program point foo():::EXIT22 appears in .dtrace file but not in any .decls file’.
Figure 7.1: Workflow of instrumenting Perl code with dfepl.
dfepl works by reading one or more Perl programs
or modules, and writing out new versions of those files, instrumented
to capture information about their execution, by default to another
directory. dfepl is used in two passes: first, before type
information is available, instrumented versions are written to a
directory daikon-untyped. These untyped programs, when run,
will write
files containing dynamically inferred type information (with the
extension .types), by default to the daikon-instrumented
directory. When dfepl is rerun with this type information, it
produces type-aware instrumented code in the
daikon-instrumented directory, which when run produces
execution traces in files with the extension .dtrace in the a
directory daikon-output.
| • dfepl options |
--absolute stores the absolute path to the output directories
(by default named daikon-untyped, daikon-instrumented or
daikon-output) in the instrumented programs, so that no matter
where the instrumented program is run, the output will go to a fixed
location. Even if these directories are given as relative paths (as is
the default), --absolute specifies that they should always be
taken as relative to the directory that was the working directory when
dfepl was run.
--no-absolute specifies the opposite, causing the output paths to be interpreted relative to the current working directory each time the instrumented program is invoked. The default, when neither option is specified, is for .types files to use an absolute path, but all others to use relative path, so that the .types files will always be in the same place as the instrumented source files that generated them, but the daikon-output directory will be created in the current directory when the program runs.
Controls the number of nested invocations of object accessor methods
to examine. For instance, suppose that the Person class has a
method mother() that returns another person (and has been
specified to dfepl as an accessor), and that $me is
an instrumented variable. If the accessor depth is 1, only
$me->mother() will be examined. If the depth is 2,
$me->mother()->mother() will also be examined. Specifying large
accessor depths is generally not advisable, especially with many
accessor methods, as the number of variables examined can be too many
for Daikon to process efficiently.
By default, the Daikon Perl trace runtime will examine at most a single level of accessors.
Look for files containing accessor lists in directory, or the
current directory if directory is omitted. For a class
Acme::Foo, accessors are methods that return information about
an object but do not modify it. dfepl cannot determine on
its own which methods are accessors, but when a list of them is
provided, it can call an object’s accessors when examining a variable
of that class to obtain more information about the object. To tell
dfepl about the accessors for Acme::Foo, make a file
listing the names of each accessor method, one per line with no other
punctuation, named Acme/Foo.accessors in the same directory as
Acme/Foo.pm.
Put generated declaration files in directory and its subdirectories. The default is daikon-output.
style should be one of combined, flat, or
tree. A style of combined specifies that the
declarations for all packages should be merged, in a file named
prog-combined.decls where prog is the name of the
program. A style of flat specifies that the declarations for
each package should be in a separate file named after the package, but
that these files should go in a single directory; for instance, the
declarations for Acme::Trampoline and
Acme::Skates::Rocket would go in files named
Acme::Trampoline.decls and Acme::Skates::Rocket.decls. A
style of tree specifies that each package should have its own
declarations file, and that those files should be arranged in
directories whose structure matches the structure of their package
names; in the example above, the files would be
Acme/Trampoline.decls and Acme/Skates/Rocket.decls.
The default is tree. Note that --decls-style and --types-style are currently constrained to be the same; if one is specified, the other will use the same value.
When --dtrace-append is specified, the instrumented program will append trace information to the appropriate .dtrace file each time it runs. When --no-dtrace-append is specified, it will overwrite the file instead.
The default behavior is to overwrite. This choice can also be
overridden, when the program is run, to always append by setting the
environment variable DTRACEAPPEND to 1.
When appending to a .dtrace file, no declaration information is ever produced, because it would be redundant to do so and Daikon does not permit re-declarations of program points.
Put generated trace files in directory and its subdirectories. The default is daikon-output.
style should be one of combined, flat, or
tree. A style of combined specifies that the traces
for all packages should be merged, in a file named
prog-combined.dtrace, where prog is the name of the
program. A style of flat specifies that the
traces for each package should be in a separate file named after the
package, but that these files should go in a single directory; for
instance, the declarations for Acme::Trampoline and
Acme::Skates::Rocket would go in files named
Acme::Trampoline.dtrace and
Acme::Skates::Rocket.dtrace. A style of tree specifies
that each package should have its own trace file, and that
those files should be arranged in directories whose structure matches
the structure of their package names; in the example above, the files
would be Acme/Trampoline.dtrace and
Acme/Skates/Rocket.dtrace.
The default is combined.
Print a short options summary.
Put instrumented source files in directory and its subdirectories. The default is daikon-untyped, or daikon-instrumented if type information is available.
Consider as many as DEPTH of the first elements of a list to be distinct entities, for the purpose of guessing their types. When subroutines return a list of values, each value may have a distinct meaning, or the list may be homogeneous. When trying to assign types to the elements of a list, the Daikon Perl trace runtime will try making separate guesses about the types of the elements of a short list, but it would be inefficient to make retain this distinction for many elements. This parameter controls how many elements of a list will be examined individually; all the others will be treated uniformly.
The default is 3.
Put all of the files that are the output of the tracing process (and therefore input to the Daikon invariant detection engine) in directory and its subdirectories. This option is a shorthand equivalent to setting both --decls-dir and --dtrace-dir to the same value.
The default behavior is as if --output-dir=daikon-output had been specified.
Use path as the location of Perl when calling the annotation
back end (a module named B::DeparseDaikon), rather than the
version of Perl under which dfepl itself is running, which
is probably the first perl that occurs on your path. For
instance, if the first version of perl on your path isn’t
version 5.8 or later, you should this option to specify another
perl program that is.
When examining nested data structures, traverse as many as num
nested references. For instance, suppose that @a is the array
@a = ({1 => [2, 3]}, {5 => [4, 2]})
If the depth is 0, then when examining @a, Daikon’s Perl trace
runtime will consider it to be an array whose elements are references,
but it won’t examine what those references point to. If the depth is
1, it will consider it to be an array of references to hashes whose
keys are integers and whose values are references, but it won’t
examine what those references point to. Finally, if the depth
is 2 or more, it will consider @a to be an array of references
to hashes whose keys are integers and whose values are references to
arrays of integers.
The default nesting depth is 3.
When referenced objects have accessor methods, or when accessors return references, the --accessor-depth and --nesting-depth options interact. Specifically, if these depths are A and R, the behavior is as if the runtime has a budget of 1 unit, which it can use either on accessors which cost 1/A or references which cost 1/R. It may thus sometimes be useful to specify fractional values for --accessor-depth and --nesting-depth; in fact, the default accessor depth is 1.5.
When --types-append is specified, the instrumented program will append type information to the appropriate .types file each time it runs. When --no-types-append is specified, it will overwrite the file instead.
The default behavior is to append. If --no-types-append is
specified, however, this choice can also be overridden, when the
program is run, to append by setting the environment variable
TYPESAPPEND to 1. There is no way to use environment variables
to force the runtime to overwrite a types file, but an equivalent
effect can be obtained by simply removing the previous types file
before each run.
Look for .types files in directory, or
daikon-instrumented if directory is omitted. When
instrumenting a module Acme::Trampoline, used in a program
coyote.pl, dfepl will look for
files named coyote-combined.types, Acme::Trampoline.types, and
Acme/Trampoline.types, corresponding to the possible choices of
--types-style. Once discovered, the files are used in the
same way as for -t.
Include type information from file when instrumenting programs or modules. Since Daikon needs to know the types of variables when they are declared, useful .decls and .dtrace files can only be produced by source code instrumented with type information. Since Perl programs don’t include this information to begin with, and it would be cumbersome to produce by hand, type information must usually be produced by running a version of the program that has itself been annotated, but without type information. The Daikon Perl trace runtime will automatically decide whether to output types, or declarations and traces, depending on whether the source was instrumented without or with types. This option may occur multiple times, to read information from multiple types files (irrelevant type information will be ignored).
Put files containing type information in directory and its subdirectories. By default, this is whatever --instr-dir is, usually daikon-instrumented.
style should be one of combined, flat, or
tree. A style of combined specifies that the types
for all packages should be merged, in a file named
prog-combined.types, where prog is the name of the
program. A style of flat specifies that the
types for each package should be in a separate file named after the
package, but that these files should go in a single directory; for
instance, the declarations for Acme::Trampoline and
Acme::Skates::Rocket would go in files named
Acme::Trampoline.types and
Acme::Skates::Rocket.types. A style of tree specifies
that each package should have its own trace file, and that
those files should be arranged in directories whose structure matches
the structure of their package names; in the example above, the files
would be Acme/Trampoline.types and
Acme/Skates/Rocket.types.
The default is tree. Note that --types-style and --decls-style are currently constrained to be the same; if one is specified, the other will use the same value.
Print additional information about what dfepl is doing,
including external commands invoked.
Next: Other front ends, Previous: dfepl, Up: Front ends and instrumentation [Contents][Index]
Daikon can process data from spreadsheets such as Excel. In order to
use such files, first save them in
comma-separated-value format,
also known as csv or comma-delimited or comma-separated-list, format.
Then, convert the .csv file into a .dtrace file (and a
.decls file) to be used by Daikon by running the
convertcsv.pl program found in the ${DAIKONDIR}/scripts
directory. For example,
convertcsv.pl myfile.csv
produces files myfile.decls and myfile.dtrace.
Important: run convertcsv.pl without any arguments in order
to see a usage message.
In order to ensure all data is processed, use Daikon with the --nohierarchy option, as follows:
java -cp ${DAIKONDIR}/daikon.jar daikon.Daikon --nohierarchy myfile.decls myfile.dtrace
In a future release, the --nohierarchy option may not be necessary, but it should always be safe to use this option.
Before running convertcsv.pl, you may need to install
Text::CSV, a Perl package that convertcsv.pl uses.
Previous: convertcsv.pl, Up: Front ends and instrumentation [Contents][Index]
It is relatively easy to create a Daikon front end for another language or run-time system. For example, people have done this without any help at all from the Daikon developers. For more information about building a new front end, see New front ends in Daikon Developer Manual.
A front end for OpenAPI, Beet, is distributed separately; see https://github.com/isa-group/Beet. Beet converts any OpenAPI specification and a collection of API requests (and responses) into input for Daikon. Beet is part of AGORA, which generates test oracles for REST APIs.
A front end for LLVM, named Udon, is distributed separately; see https://github.com/markus-kusano/udon. It can be used on any programming language that can be compiled to LLVM.
A front end for WS-BPEL process definitions, named Takuan, is distributed separately; see http://web.archive.org/web/20160528161316/https://neptuno.uca.es/redmine/projects/takuan-website.
A front end for the Eiffel programming language, named CITADEL, is distributed separately; see https://se.inf.ethz.ch/people/polikarpova/citadel/.
A front end for the Simulink/Stateflow (SLSF) programming language, named Hynger, is distributed separately; see https://github.com/verivital/hynger.
A front end for the IOA (Input/Output Automata) programming language is distributed separately; see http://groups.csail.mit.edu/tds/ioa.html.
An earlier version of Daikon included a Lisp front end, but it is no longer supported.
An earlier version of Daikon provided a source-based front end for Java
named dfej. It has been superseded by Chicory (see Chicory).
An earlier version of Daikon provided a source-based front end for C
named dfec. It has been superseded by Kvasir (binary-based, for
Linux/x86-64; see Kvasir).
Previous: convertcsv.pl, Up: Front ends and instrumentation [Contents][Index]